|
The Z-WAVE EXPERT USER INTERFACE is perfectly suited to troubleshoot networks and find and fix problems. Troubleshooting a Z-Wave network works along the lines of the communication stack.
Problems can occur on the radio layer, the networking layer, and the application layer. To identify and fix problems, it makes sense to work bottom up through the network stack issues.
Most of the troubleshooting functions are accessible on the menu item Analytics. However, this menu item will only be displayed if the firmware on the Z-Wave chip supports some special functions needed for troubleshooting purpose.
Problems on the radio layer come from interference and noise generated by defect or nonconforming electrical gear causing electromagnetic emissions (baby monitor, old cordless phones, wireless speakers, motors, etc.). Other Z-Wave networks with unusual high traffic can also be a root cause of problems. It is also possible that certain other wireless networking services (first and foremost cellular network G4 routers or base stations, also called LTE) may cause interference if they are too closed to the Z-Wave network.
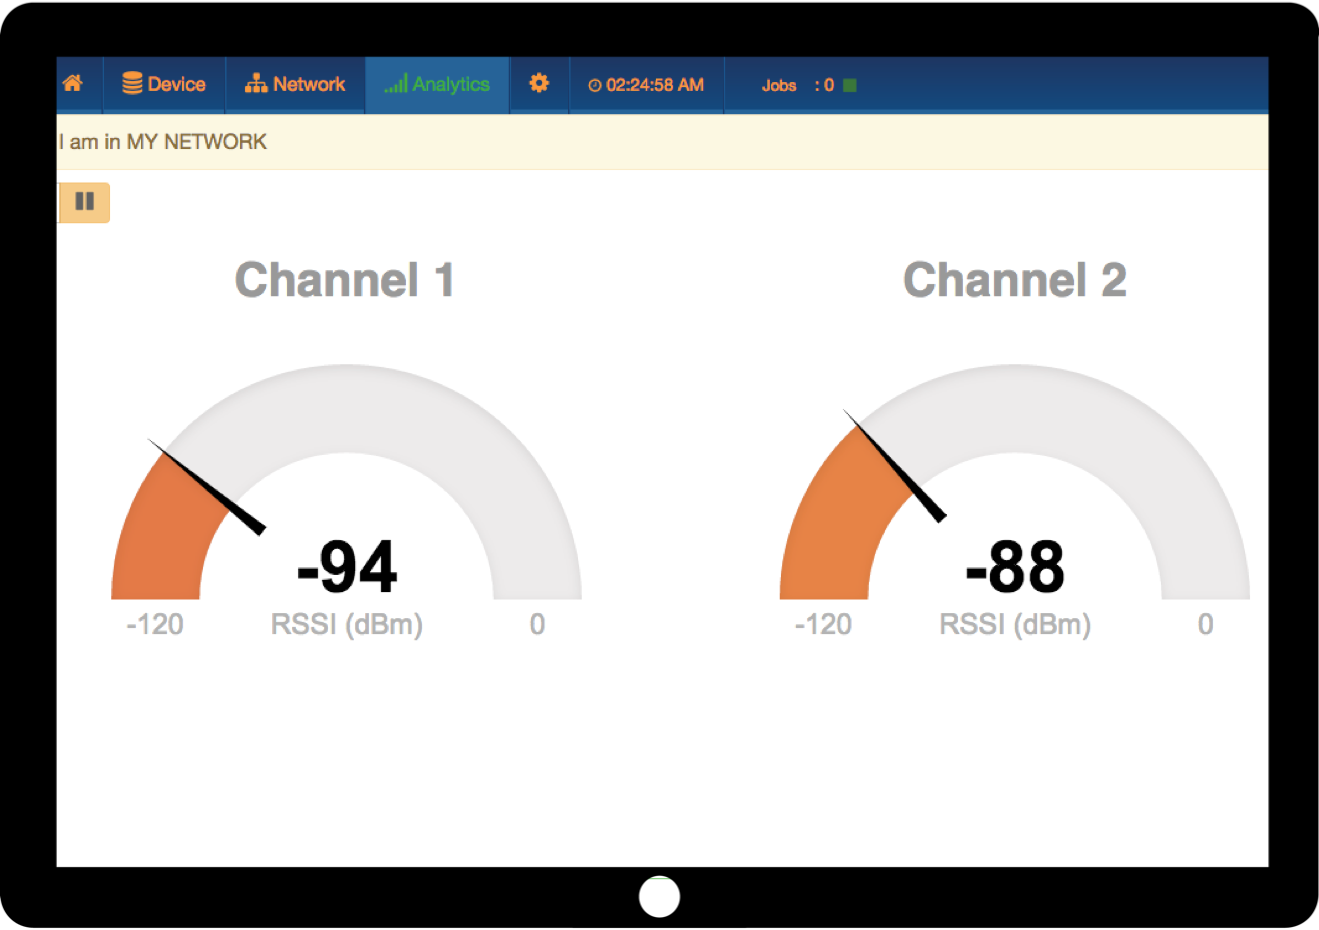
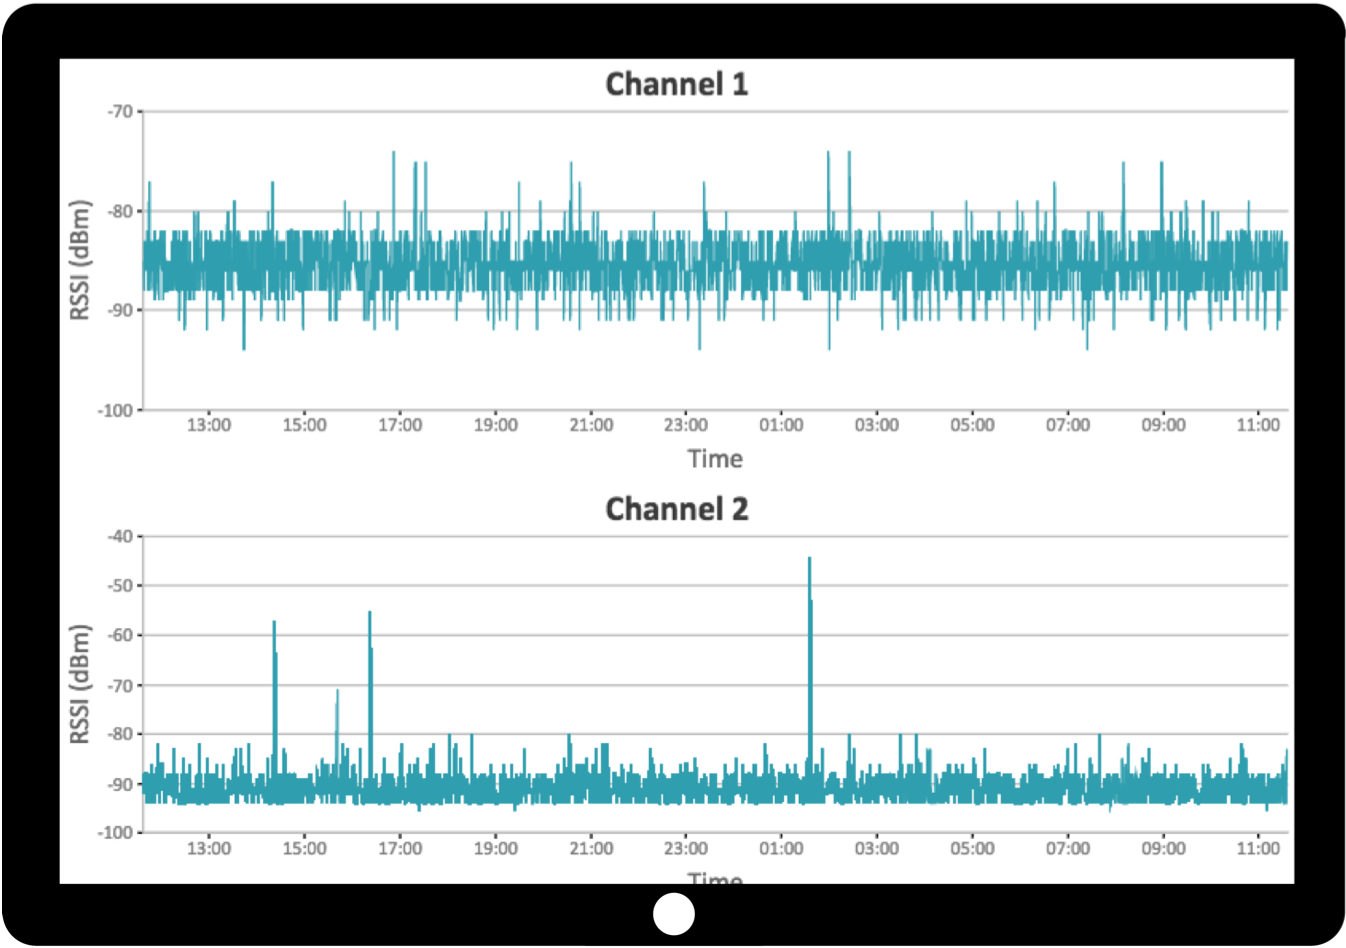
The menu item Analytics > Background Noise offers a view chart displaying the background noise on the two communication channels used by Z-Wave. Channel 1 refers to the 9.6 Kbit/s and 40 kbit/s communication modes, channel 2 points to the 100kbit/s data rate. Figure 8.1 shows this viewgraph. There is an obvious floor of noise with some other “needles.” This noise floor—in Figure 8.1 at about -85 dBm for channel 1 and -90 dBm for channel 2—is the minimum level a Z-Wave transceivers signal must surpass in order to be decoded by the Z-Wave receiver.
The lower the noise level the better the wireless situation. Noise levels below - 95 dBm are very good, levels above -70 dBm are very bad.
Please note that this noise level is measured right on the controllers location or wherever the hardware running Z-Way is positioned. It may make sense to move the measuring device around to see the noise level at different locations. Since the Analytics > Background Noise viewgraph is only updated once per minute, you may want to use the tool Analytics > Noise Gauge, as shown in Figure 8.2. In this case, the display is updated every two seconds.
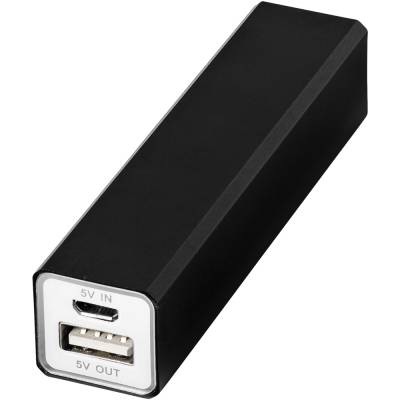
If the noise floor is too high, you need to find the source of the noise. The device running Z-Way can be used as mobile device too, thanks to the built-in Wi-Fi. In this case, it needs to be powered with a power bank as shown in Figure 8.3.
Walking around with the Noise Gauge enabled may help to track down the jamming device. The closer the controller hardware gets to the source of the noise, the higher the background noise level will be.
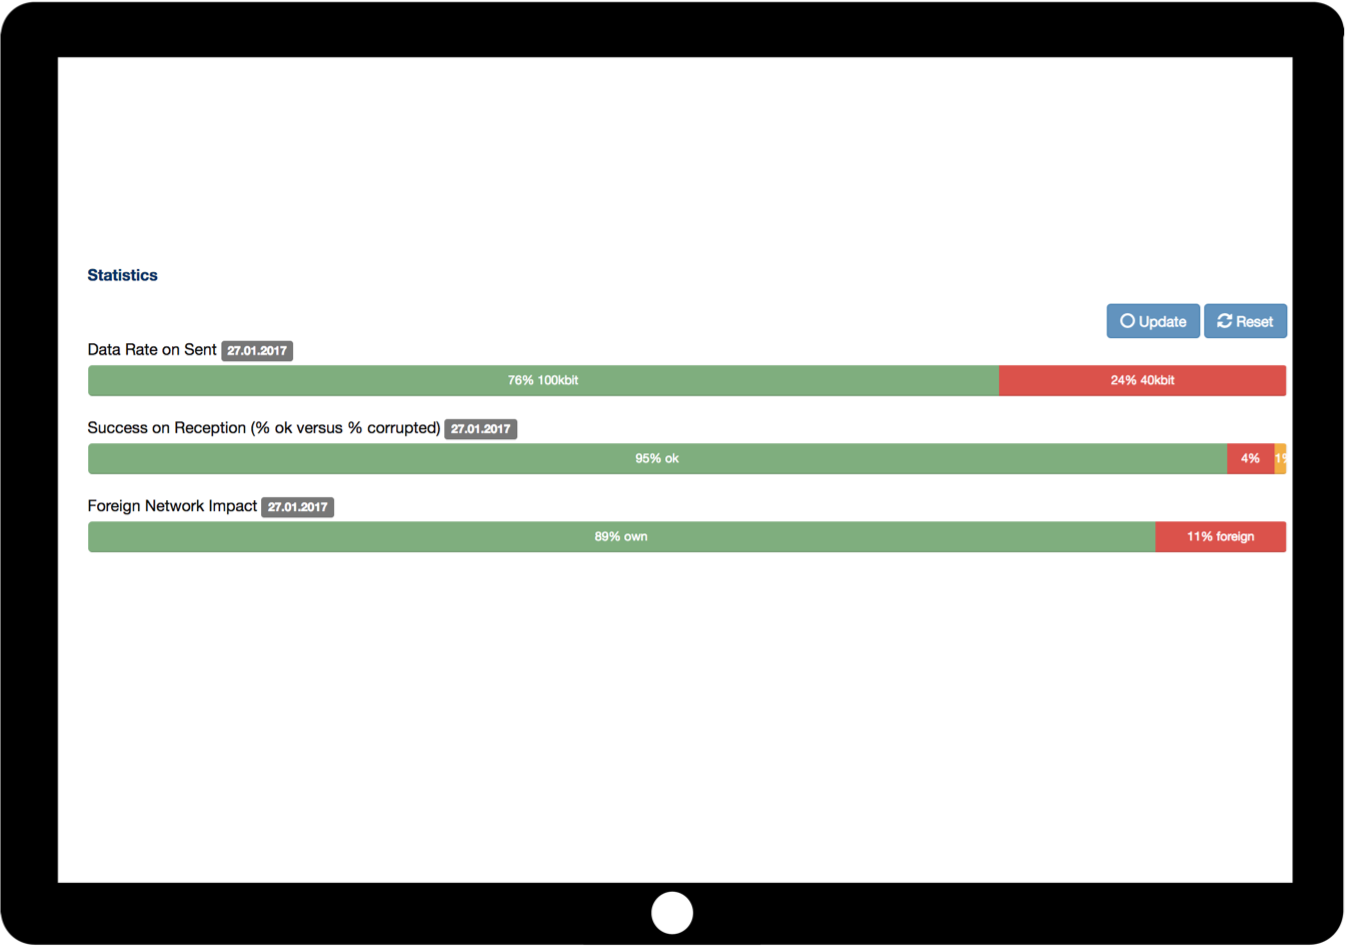
The “needles” above the noise floor show communication from other Z-Wave networks around. Having this is not a real problem unless other networks generate heavy traffic. A rule of thumb is that there should not be more than 30 % of the time allocated by traffic of other Z-Wave networks. If there is more traffic, there will be a need to troubleshoot the other Z-Wave network first. The chart Analytics > Network Statistics, as shown in Figure 8.4, shows a ratio of own traffic versus traffic seen from other networks.
Devices can have two faulty states:
Another option to detect faulty devices is the Network > Timing Info View.
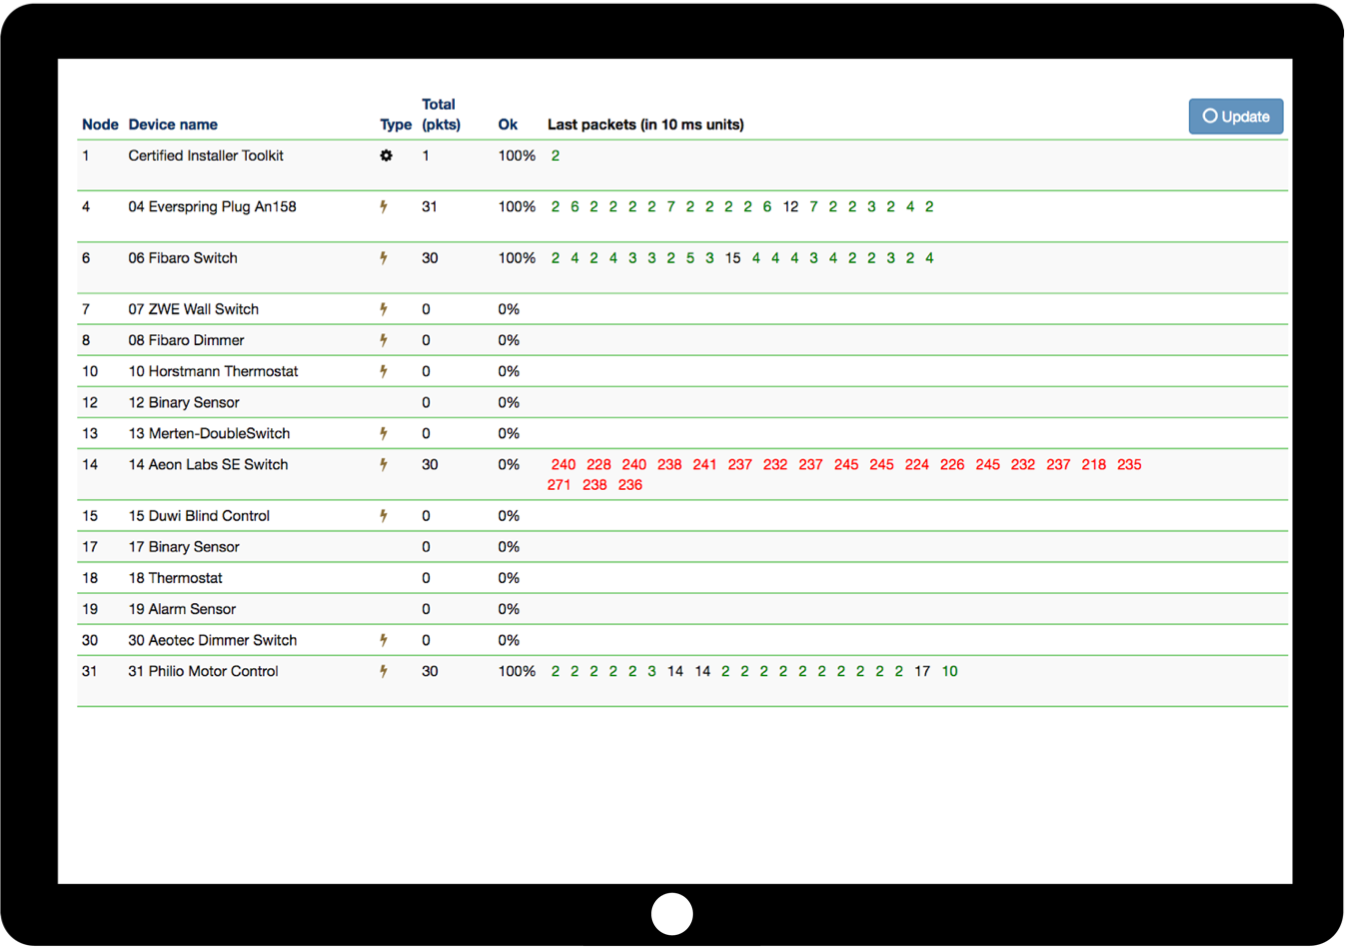
Figure 8.7 shows this view. The timing information lists one entry for every communication between the controller and the device. The number refers to the time (in x * 10 ms) the message took before being confirmed; the color gives a rough indication of what happened:
Figure 8.7 shows the situation in a network just installed. It can be seen that there is only communication with few devices, e.g. no polling of sensors, etc. While this is not a problem, the chart shows that devices 4, 6, and 31 are in direct range and all communication works perfectly well (green, low number). Device 14 seems to be a real problem child. The controller tries all the time to reach this node but always fails. At some point in time, the controller will accept that node 31 is dead and put him into the “failed node list.”
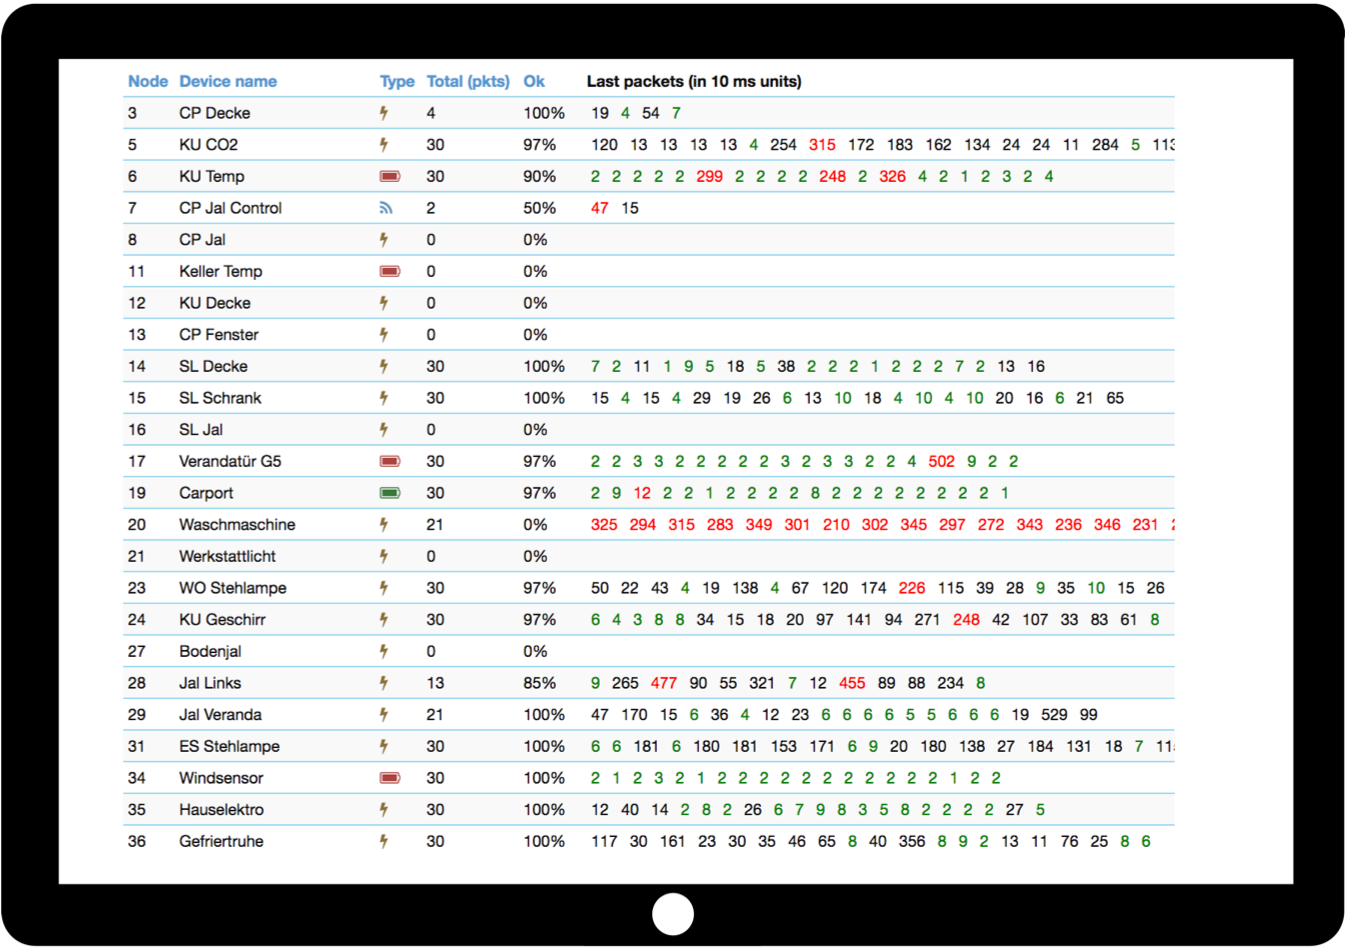
Figure 8.8 shows a network that is a bit more complex, has more communication and is aged. Again node 20 is a defect device that just needs to be replaced. The following interesting patterns can be seen:
Anyway, the controller seems to understand that direct range is the by far best option and constantly tries to reach the node in direct range. The same pattern can be seen for nodes 29 and 31.
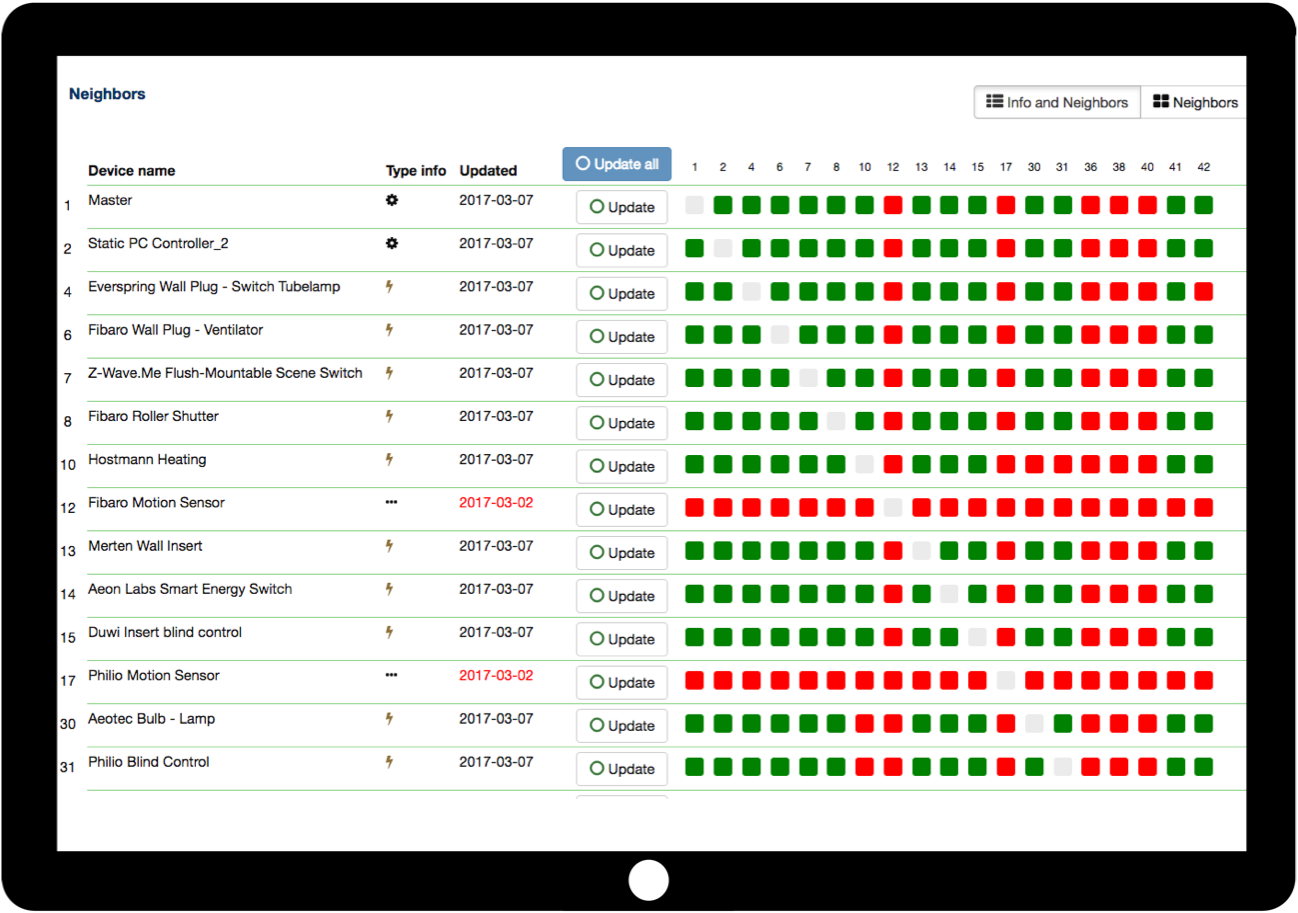
It is the best already knowing the troublemaking devices. In this case the status of device can be checked quickly and it is possible to dig deeper into the routing layer. Figure 8.9 shows the routing table of a controller. Technically this is not a routing table but a matrix indicating the wireless neighborhoods of devices. Nevertheless, this a good starting point to investigate deeper. Having many neighbors is a good thing since the routing algorithm has many options in case something goes wrong. On the other hand, just having one other route to communicate to the rest of the network may cause trouble if this route is faulty or moved.
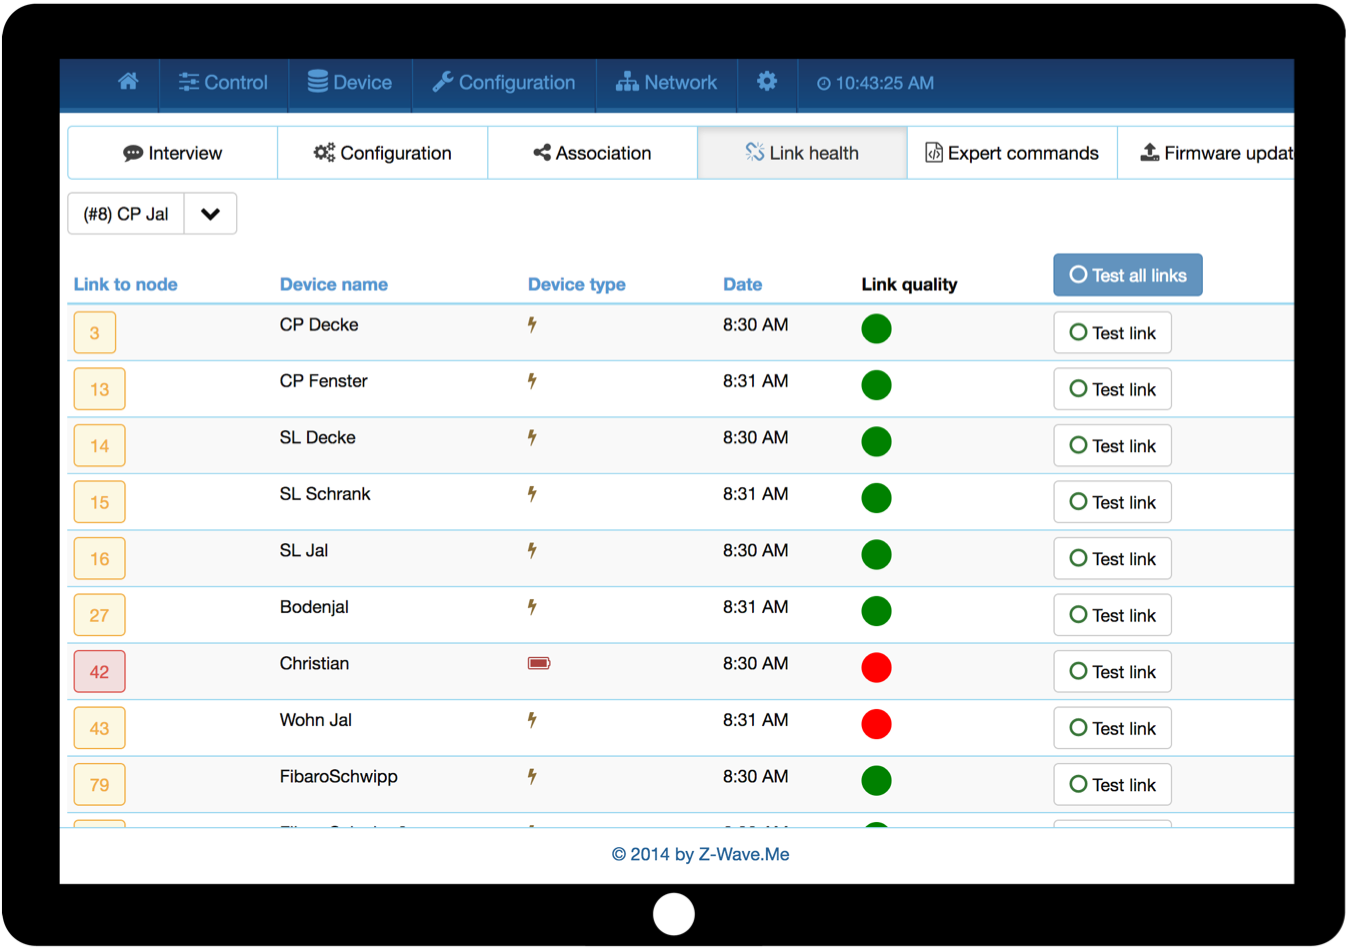
The next step is to check individual routes. The configuration page of every device offers a link health check that allows testing the links from this very device to its neighbors.
While the neighborhood table shows if two devices are neighbors, the link test checks how good this wireless links is. Unfortunately, not all but an increasing number of devices on the market support this link test. Figure 8.10 shows this dialog within Z-WAVE EXPERT USER INTERFACE . Every link has a color indicator (green = ok, red = bad, grey = unknown) and a time stamp that shows when this test was done the last time.
Please note that the link check is a momentary analysis only and does not give any information about the history of the link quality.
In the application layer, there is usually no malfunction of a device but wrong configurations. Z-WAVE EXPERT USER INTERFACE allows changing and monitoring the values.
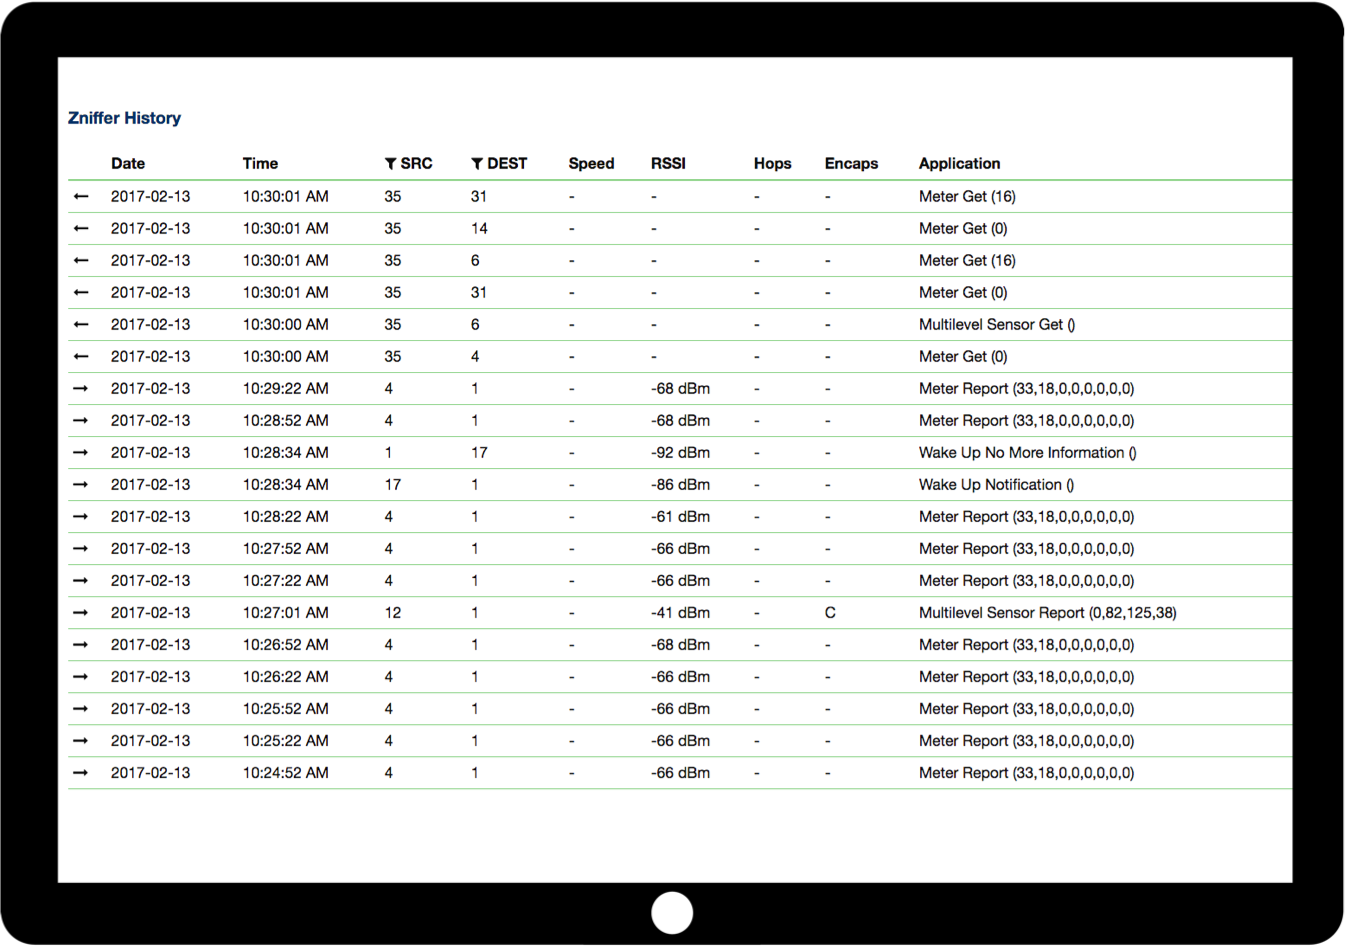
Heavy polling of devices causes network traffic leading to delays. A simple look on the sniffer as shown in Figure 8.6 reveal if there is too much polling.
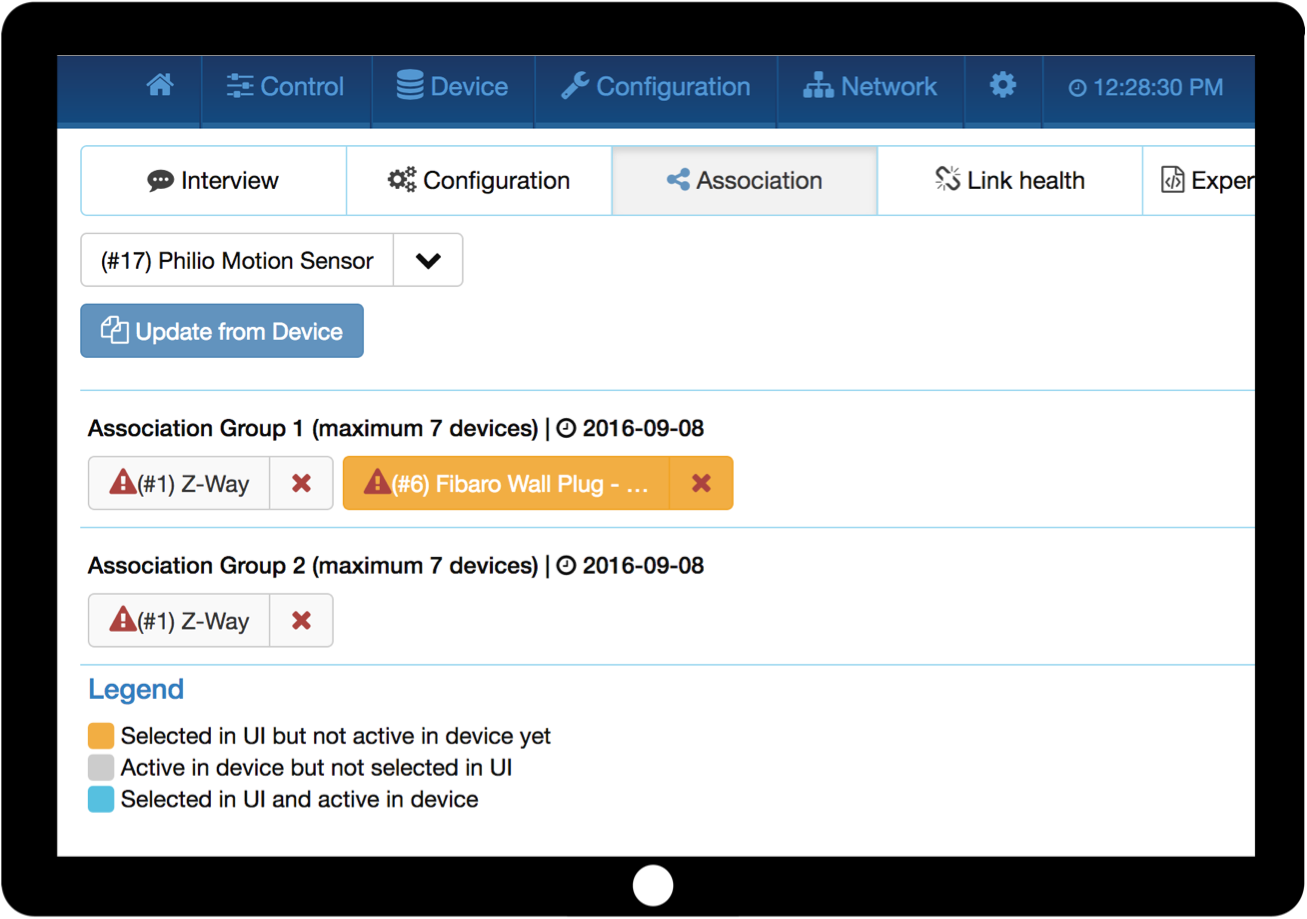
Association enable direct communication between devices. In case there are more than one device in an association group, they will receive a command one after each other. A very common problem is that associations are set during the built-up of the network and later certain devices are removed or simply fail. If this disappeared node is still in an association group, the device will always try to communicate to this node first before communicating to other nodes. The result is a delay. The device-specific configuration overview as shown in Figure 8.11 displays all association that are set. It is possible to recall the current associations from the device and to remove or set associations.
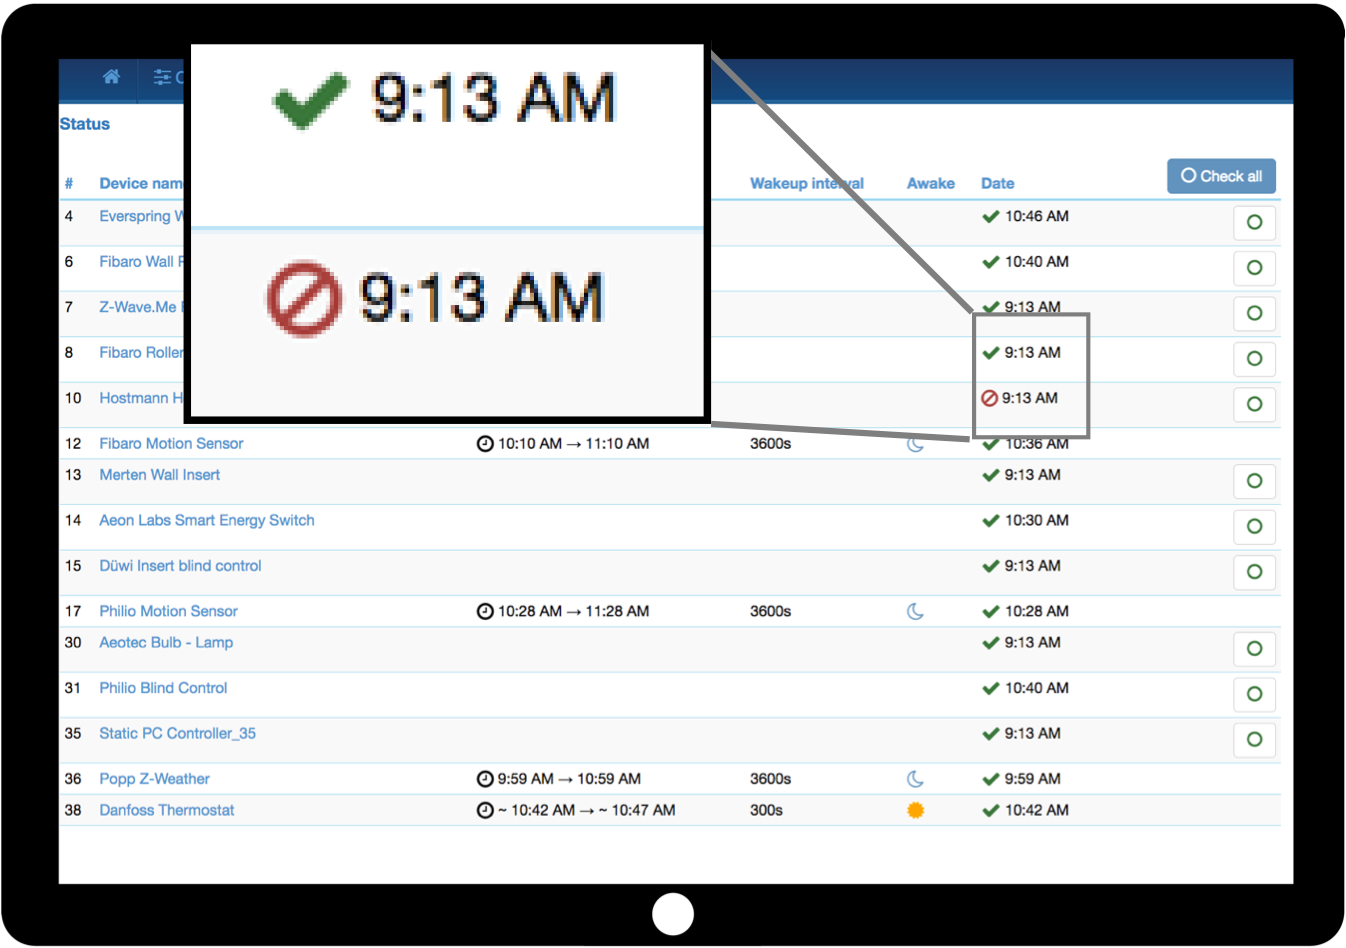
Wrong wakeup settings may either result in too much traffic draining the battery, or in too slow response to sensor update requests or configuration changes. The status overview page as shown in Figure 8.5 gives a simple overview of the wakeup settings of the different battery-operated sleeping devices. The device-specific configuration settings allow changing these settings. Besides the wakeup interval, the setting also allows setting/changing the Node ID of the controller holding the mailbox of this device. This setting must reflect the correct situation in the network.
Table 8.1 summarizes the possible “10 root causes of Z-Wave network problems’’ and suggestions how to fix them.